The State of Zava: a fictional state, a real problem, a working prototype
A state CISO is accountable for hundreds of organizations they can't give orders to. I built a dashboard to find out what that actually takes.
A state CISO told me something that stuck with me:
I have 150+ entities I’m responsible for. Some are running modern security stacks. Others are still figuring out MFA. When the Governor asks me about our security posture, I’m pulling data from a dozen different systems and hoping I don’t miss something critical.
That’s not a tooling problem. That’s a visibility problem. And instead of writing a requirements doc about it, I built something.
Meet the State of Zava — a fictional state with a very real problem, and a working prototype to solve it.
Explore the interactive prototype
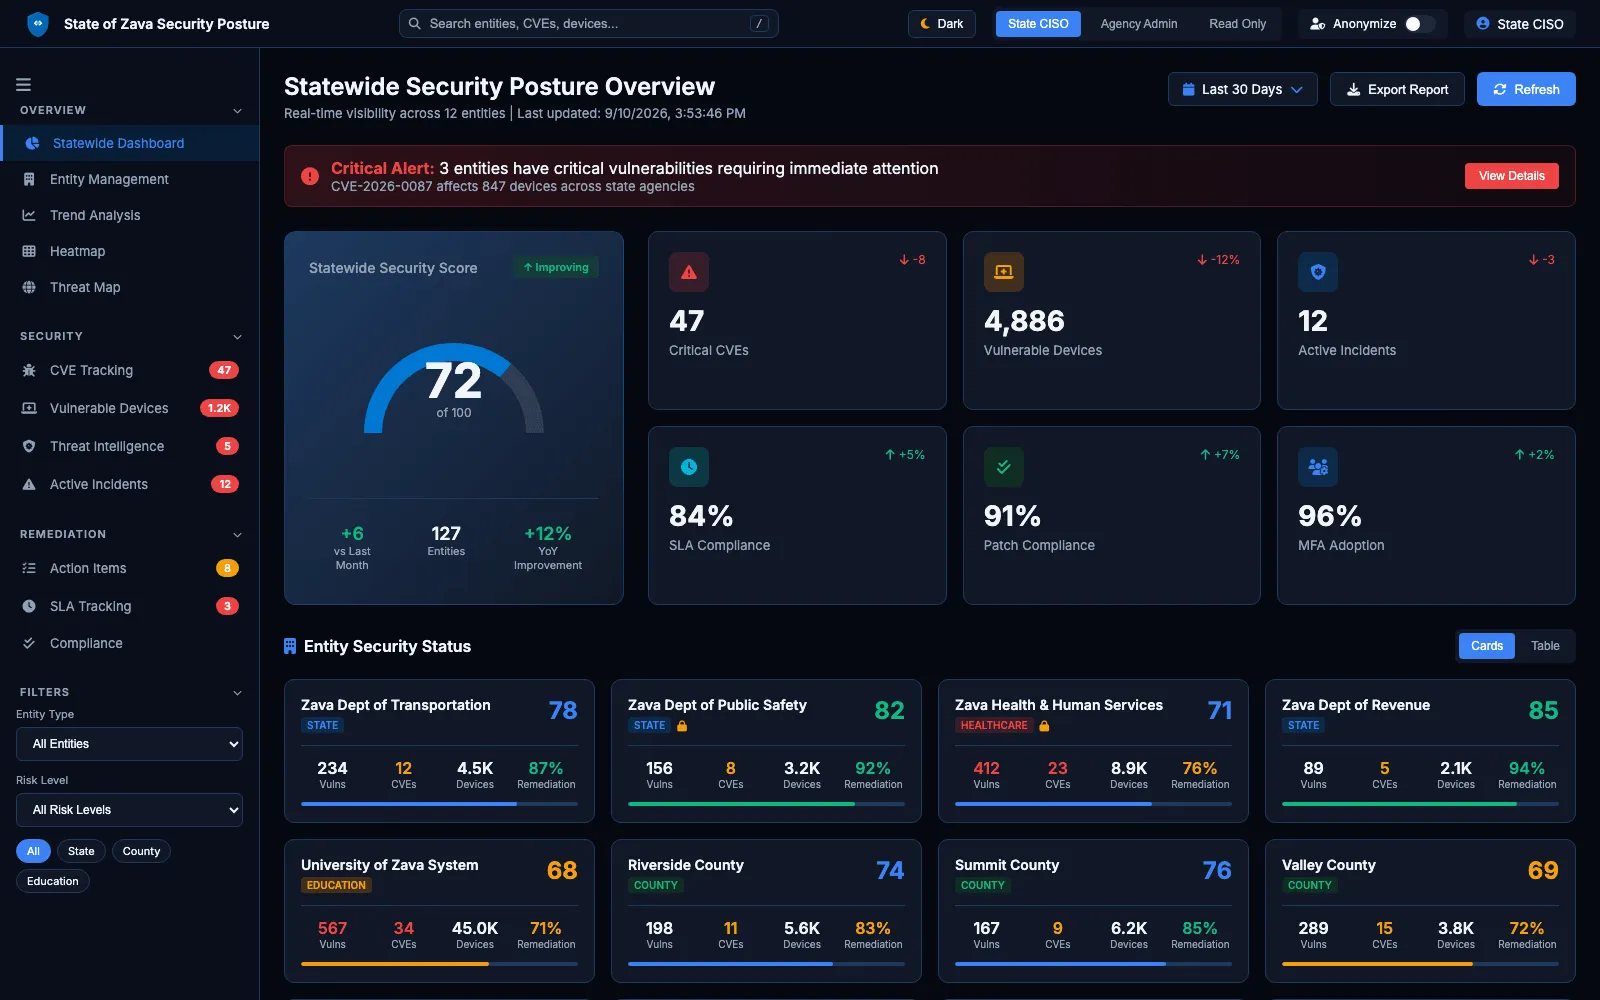
The opening view. The 72 is the elevator-pitch number — the thing a CISO can say out loud to a Governor without building a deck first. Everything above it is clickable, because the score is useless until you can answer “which of these is dragging it down.”
Why this problem is uniquely hard in government
State CISOs aren’t protecting one organization. They’re responsible for hundreds — agencies, counties, school districts, healthcare systems — each with their own IT teams, budgets, and security maturity. All reporting up to one person who needs visibility across all of it.
Four things make it especially difficult.
Federated authority. Unlike a private enterprise CISO who can mandate standards, state CISOs often have advisory relationships with counties and municipalities. They need to influence without direct control.
Massive scale variance. A state might have agencies with 10,000 employees and counties with 50. The same dashboard needs to make sense for both.
Regulatory patchwork. Healthcare entities need HIPAA. Education needs FERPA. Critical infrastructure has its own standards. A unified view has to respect those differences.
Political sensitivity. Publicly shaming an underperforming county isn’t an option. CISOs need to drive improvement through collaboration — which means how you visualize the data matters as much as the data itself.
So I built a prototype
Rather than sketch wireframes or write a requirements doc, I opened VS Code and started a conversation with GitHub Copilot. I went from concept to working prototype faster than I expected.
The goal was simple: a single pane of glass that gives a state CISO immediate answers to questions like:
- What’s my overall security posture across all entities?
- Which agencies have critical vulnerabilities right now?
- Are my counties keeping up with remediation SLAs?
- Where are my compliance gaps?
What emerged was a fully interactive dashboard with drill-downs, role-based views, and real-time filtering — all running as a single HTML file with no backend dependencies.
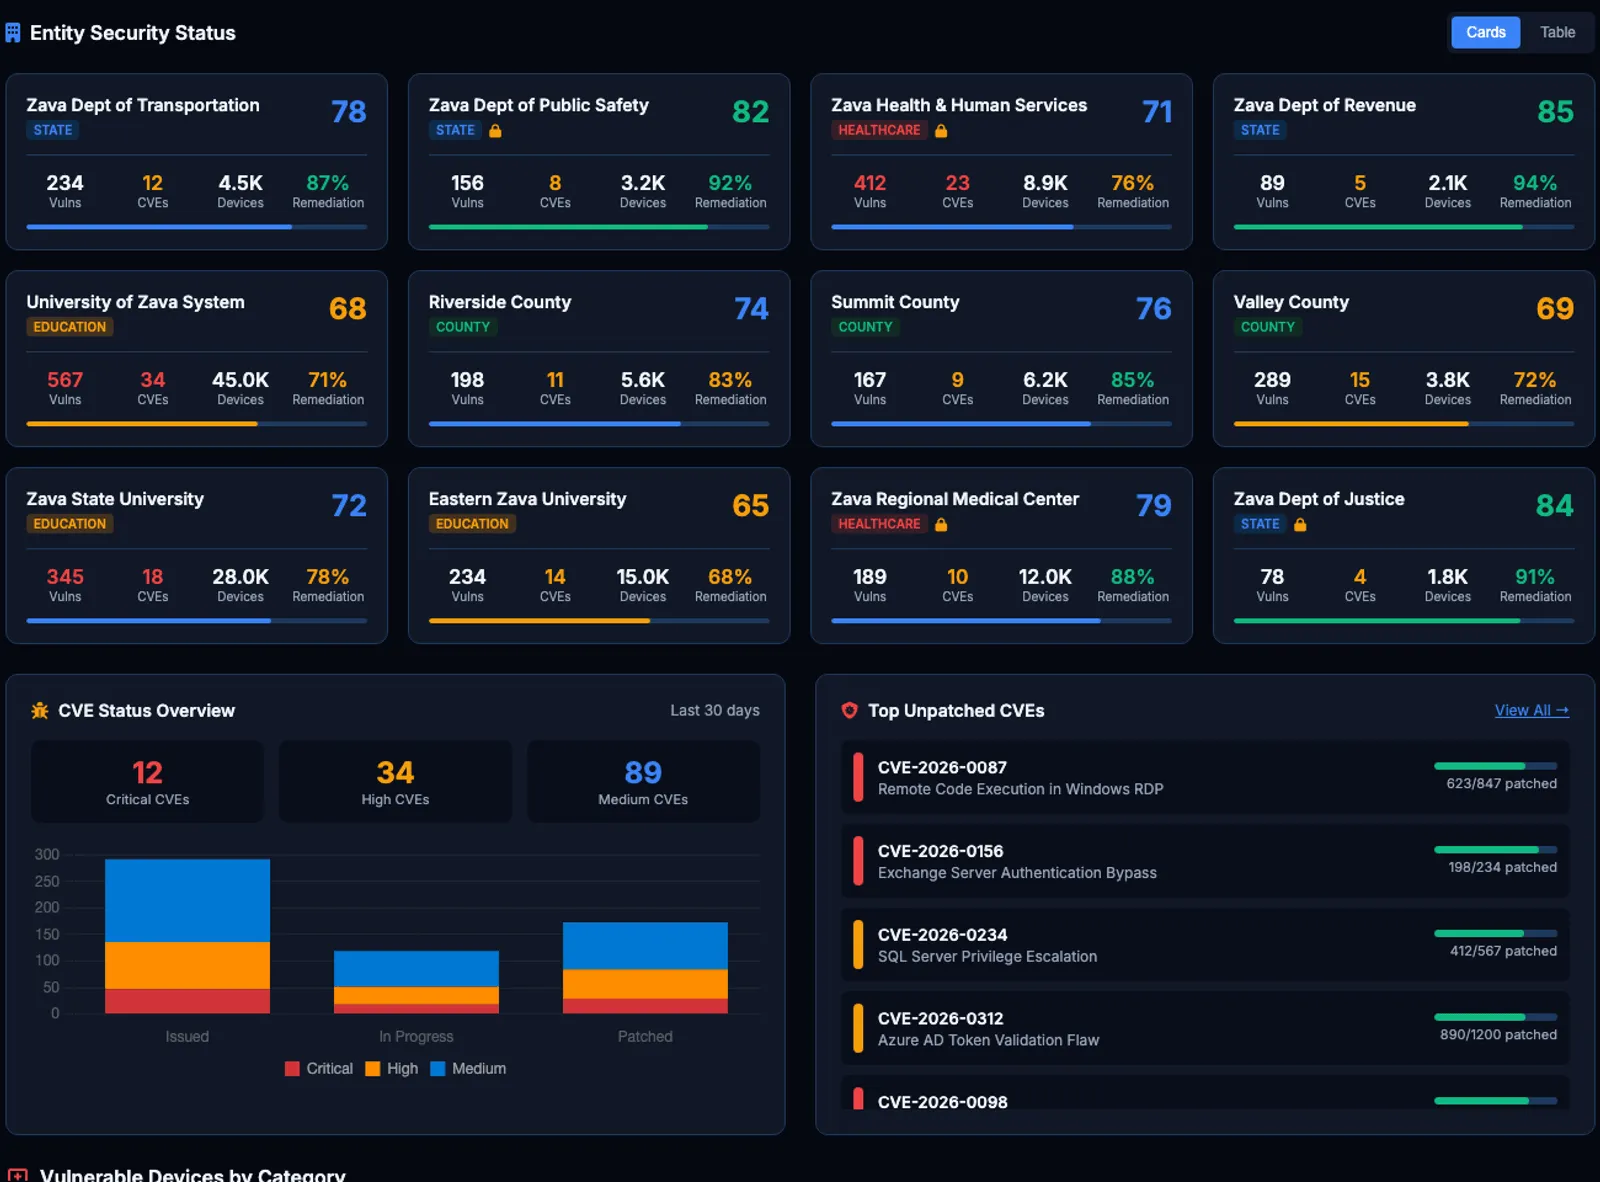
Twelve entities, four metrics each, one color language. A county with 289 vulnerabilities and a university with 567 need different conversations, and the CISO needs to see which is which before picking up the phone.
What we built
Statewide posture at a glance
The dashboard opens with the KPIs that matter: critical CVEs, vulnerable devices, active incidents, SLA compliance, patch rates, and MFA adoption. Each metric is clickable, drilling into the specific entities and systems behind the number.
A posture score from 0 to 100 provides the elevator-pitch metric — something a CISO can report to leadership without building a 20-slide deck.
Entity-level drill-downs
Click any entity card and you get the full picture: score trends, open vulnerabilities by severity, compliance status, recent incidents, and assigned remediation tasks. This is where advisory becomes actionable — CISOs can see exactly where to focus the conversation.
Remediation tracking with teeth
The most requested feature was real remediation management.
- Action items. Every vulnerability gets assigned, tracked, and time-stamped. Who owns it, what’s the status, when was it last updated.
- SLA monitoring. P1 vulnerabilities get 24-hour SLAs, P2 gets 72 hours. The dashboard flags breaches before they happen and escalates automatically.
- Compliance mapping. Each remediation item maps to NIST CSF, CIS Controls, and CISA KEV. When you fix a vulnerability, you can see exactly which boxes it checks.
Role-based views
A state CISO needs to see everything. An agency IT director only needs their slice. The dashboard supports both with a toggle — same interface, appropriately scoped data.
There’s also an anonymization mode for presentations. When briefing legislators or sharing screenshots, you can mask entity names to avoid political blowback while still showing the real patterns.
Threat intelligence integration
Modern CISOs don’t just react to vulnerabilities, they anticipate threats. The dashboard integrates threat intelligence feeds, showing active campaigns, indicators of compromise, and which entities might be affected based on their technology stack.
What’s next
Part two: “Yes, it can update in real time. Here’s the architecture.” That’s the first question everyone asks, and I want to give the honest answer.
All data shown in the prototype is synthetic. No real customer information, security metrics, or entity details were used.